
1.3.2How can I describe a changing graph?
Slope Statements and Finite Differences of Non-Polynomials
The path of the roller coaster is shown below.

Describe the path of the roller coaster so that someone who has not seen it can draw it. Be sure to include words that will help to describe the steepness of the curve as well as its direction.
When writing a slope statement, it is reasonable to start at the left of the graph and move right—just like you read a sentence in English. Make a list of words that are useful when describing the path of a graph.
The following two slope statements describe the same graph. Read both statements. Then sketch a graph of the function described.
“The graph starts off flat at the left and starts to increase at
“The graph starts off flat at the left but slowly gets steeper. The slope starts getting really steep at
Finite differences can be used to analyze the slope of a graph at various
Your team will be assigned one of the function groups listed below to investigate. For each of the two functions in your function group, complete the following tasks:
Graph the function.
State the domain and range using appropriate notation.
Analyze the finite differences.
Write a slope statement.
Function Group | Equation (a) | Equation (b) |
|---|---|---|
Rational | | |
Trigonometric | ||
Exponential | ||
Logarithmic | ||
Radical | |

Write a piecewise-defined function that will generate the graph at right. Homework Help ✎
.png)
State the domain of each of the following functions. Homework Help ✎
Simplify:

Common Trigonometric Identities
Reciprocal
Pythagorean
Angle Sum
Double Angle
Calculus problems often require using one or more of the trigonometric identities to solve problems. Solve each of the following equations on the interval
For each part below, give an example of a function with specified attributes. Provide a sketch of each function. Homework Help ✎
A function with a hole at
and an asymptote at . A function with asymptotes at the
-axis and and a hole at . A function with an end-behavior function
.
Some of the basic functions have special qualities that you have investigated in this chapter. 1-118 HW eTool. Homework Help ✎
Sketch
on your paper. Darken in the largest portion of the graph containing for which the function passes both the horizontal and vertical line tests. State the restricted domain and range for this portion of the graph. We use the darkened portion of the graph to sketch
, making sure it is a function. Then state the domain and range. Repeat parts (a) and (b) for
.
A function
A flag in the shape of a quarter-circle is shown at right. Homework Help ✎
.png)
Imagine rotating the flag about its pole and describe the resulting three-dimensional figure. Draw a picture of this figure on your paper. Try this using the 1-120 eTool
Calculate the volume of the rotated flag.
WHICH IS BETTER? Part Two
Below is a comparison between using rectangles and trapezoids to approximate the area under a curve for the same interval of a function. Decide which method you think will best approximate the area under the curve for
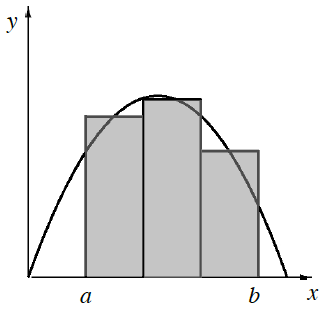
Midpoint Rectangles
.png)
Trapezoids